SPECIAL OFFER ✦ BUY 2 GET 1 FREE! ✦ ADD 3 PRODUCTS TO YOUR CART, AND THE DISCOUNT APPLIES AUTOMATICALLY!
SPECIAL OFFER ✦ BUY 2 GET 1 FREE! ✦ ADD 3 PRODUCTS TO YOUR CART, AND THE DISCOUNT APPLIES AUTOMATICALLY!
SPECIAL OFFER ✦ BUY 2 GET 1 FREE! ✦ ADD 3 PRODUCTS TO YOUR CART, AND THE DISCOUNT APPLIES AUTOMATICALLY!
SPECIAL OFFER ✦ BUY 2 GET 1 FREE! ✦ ADD 3 PRODUCTS TO YOUR CART, AND THE DISCOUNT APPLIES AUTOMATICALLY!
Creativity meets clarity when data joins the process. Data driven design transforms scattered user actions into patterns that inform better choices. From websites to campaigns, this method ensures designs resonate where they matter most. Want to see why so many brands rely on it? Let’s take a closer look!
Key Takeaways:
Evidence-based methods ensure designs align with both user needs and business goals.
This method offers several advantages, such as improving UX, audience relevance, and adaptability.
For creatives, it balances intuition with measurable insights.
Understanding Data-Driven Design
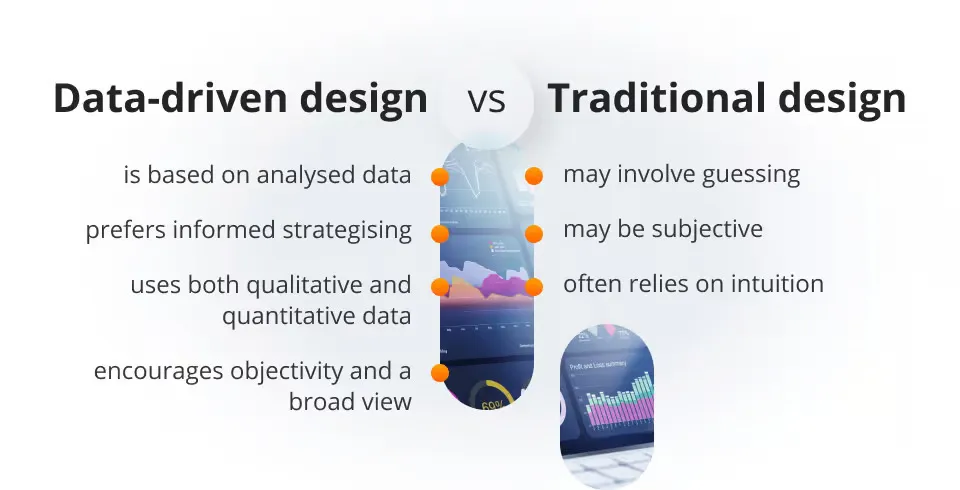
Key difference between data-driven design and traditional design (Source: Future Processing)
Designing from data is an approach that utilizes real evidence to inform creative decisions, rather than relying solely on intuition or assumptions. By analyzing user behavior, performance metrics, and even market shifts, designers gain a clearer picture of what actually works.
This method eliminates the guesswork in the creative process, enabling teams to craft solutions that are both practical and meaningful. The result is a design that aligns user needs with business visions. In many ways, it allows design to become more adaptable and responsive, a balance between artistry and evidence.
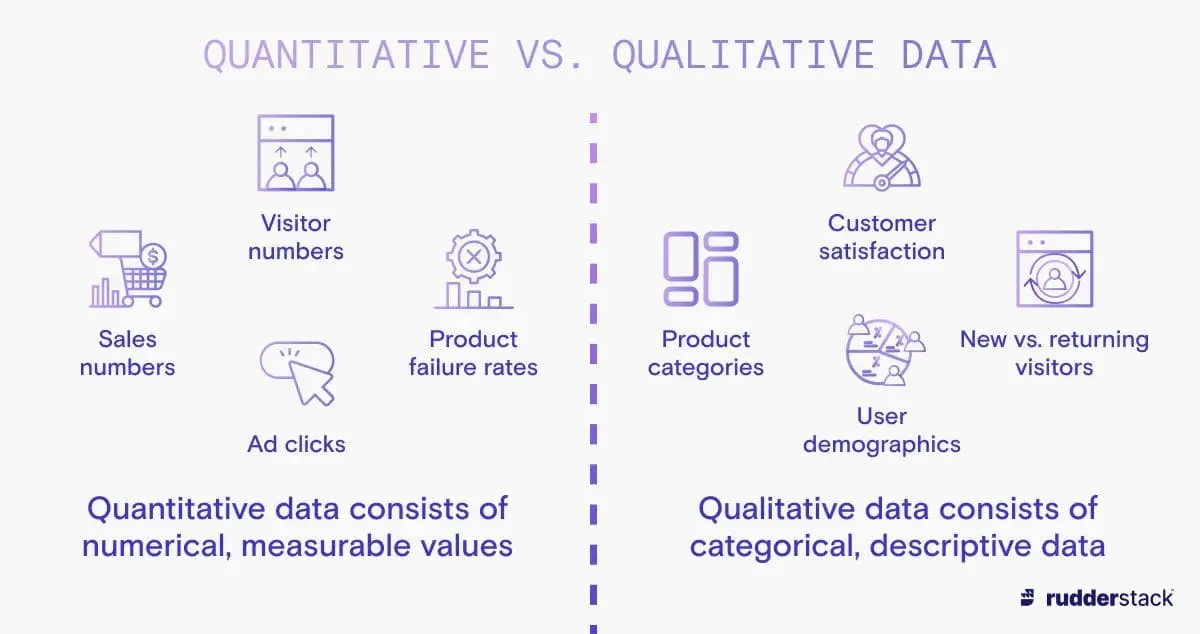
Qualitative & Quantitative Data (Source: Rudderstack)
Every project begins with a foundation of information. Instead of making choices based purely on intuition, teams use data as a compass to shape initial design strategies. This approach makes the workflow more systematic while still leaving space for creativity.
The process usually starts with two main types of data:
1. Quantitative Data
Hard numbers such as traffic volume, conversion rates, click-through statistics, and user flows. These insights are often gathered through analytics platforms, heatmaps, or structured A/B tests.
2. Qualitative Data
More descriptive feedback from user interviews, surveys, or usability sessions. This type of data helps explain why users behave in certain ways, adding depth beyond raw numbers.
When combined, these insights highlight patterns, reveal user frustrations, and guide decisions in everything from UI adjustments to branding choices. For instance, A/B testing is widely used in data driven web design to compare layouts or calls-to-action, ensuring that the final choice resonates with real user behavior.
A typical workflow often looks like this:
Defining clear goals and KPIs that connect user needs with business objectives.
Collecting and analyzing data through research methods and digital tools.
Extracting actionable insights and spotting key behavior trends.
Applying those insights to design decisions aimed at improving usability or conversions.
Refining designs through prototypes, testing, and ongoing feedback loops.
By following this cycle, data becomes a steady guide throughout the creative process. Practically ensuring decisions are based on actual information, not just inspired.
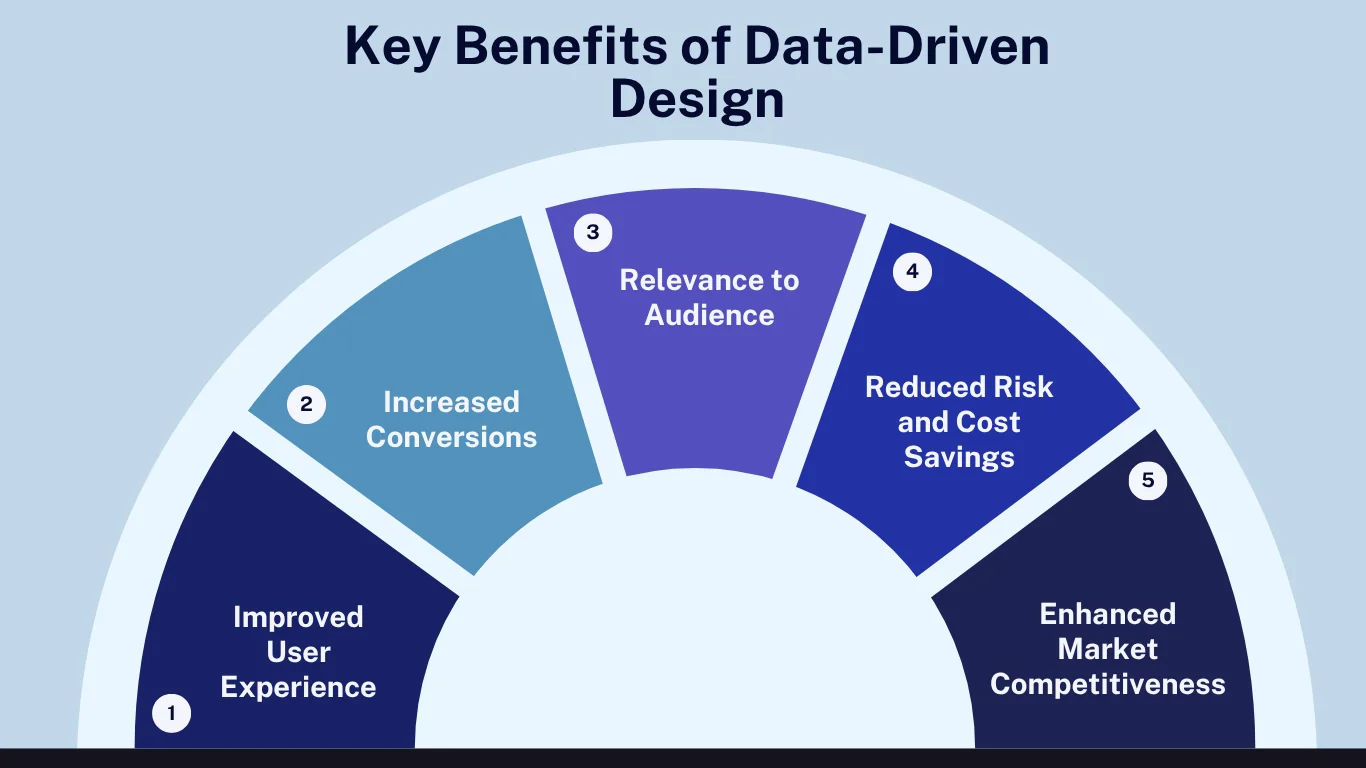
Benefits of data-driven design (Source: Canva.com)
Adopting this approach in creative work helps bridge the gap between user needs and design outcomes, ensuring that projects are guided by evidence rather than assumptions. Let’s look at each benefit that supports both usability and business effectiveness practically.
Improved User Experience: By observing how people actually interact with products or interfaces, designs can address real challenges. This makes interactions smoother and more intuitive, a key principle in data driven UX design.
Increased Conversions: Insights from analytics help optimize buttons, forms, and user flows to encourage sign-ups, purchases, or other desired actions.
Relevance to Audience: Data reveals user preferences and behaviors, allowing campaigns or visual choices to align more closely with what the audience values.
Reduced Risk and Cost Savings: Testing ideas early uncovers what works best, minimizing unnecessary revisions and keeping resources focused.
Enhanced Market Competitiveness: Continuous adaptation based on feedback and trends ensures that brands remain agile and responsive in a fast-changing landscape.
Many leading companies use data as a foundation for their creative strategies. These examples show how evidence-based decisions shape user experiences, branding, and even visual campaigns.
1. Google
Google Search (Source: Google)
Google applies A/B testing and analytics to refine interfaces like Search and YouTube, ensuring layouts and features meet user needs.
2. Netflix
Netflix Interface (Source: HDTVtest)
Netflix relies on viewing data to personalize recommendations and adapt its interface for seamless engagement.
3. Amazon
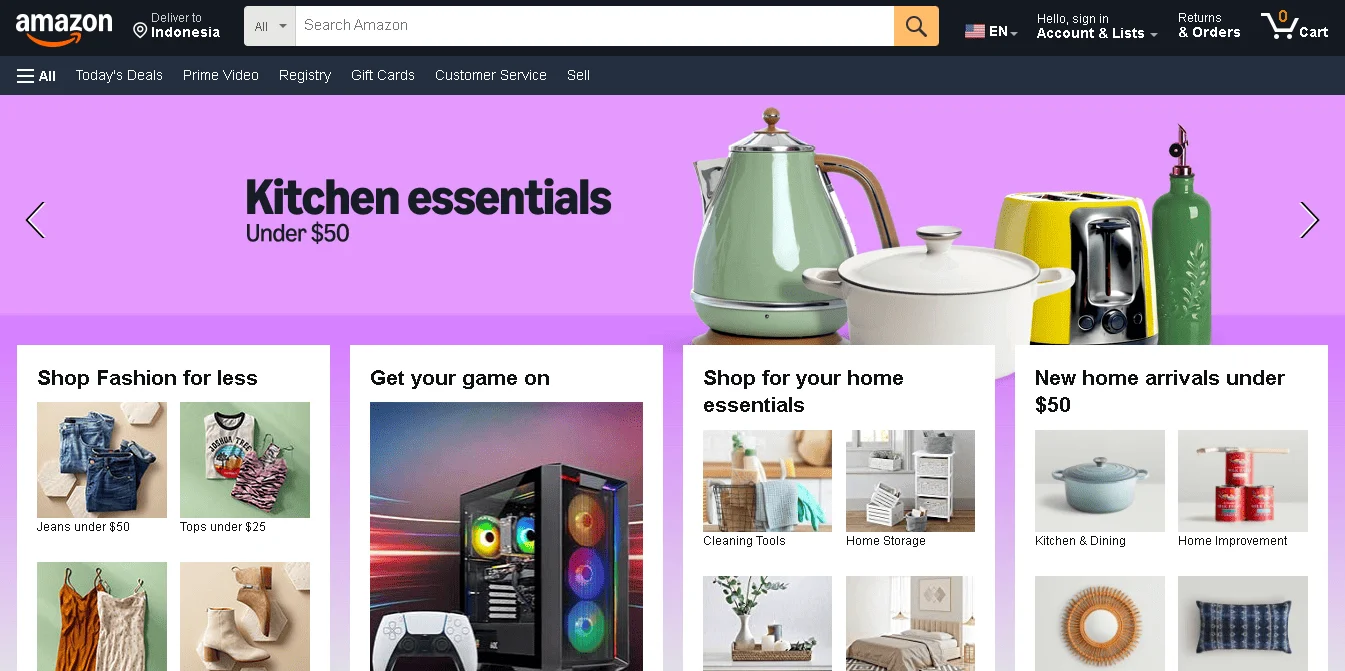
Amazon Product Recommendation (Source: Amazon)
Amazon uses interaction data to guide product recommendations and streamline its e-commerce layout for higher conversions.
4. Meta (Facebook)
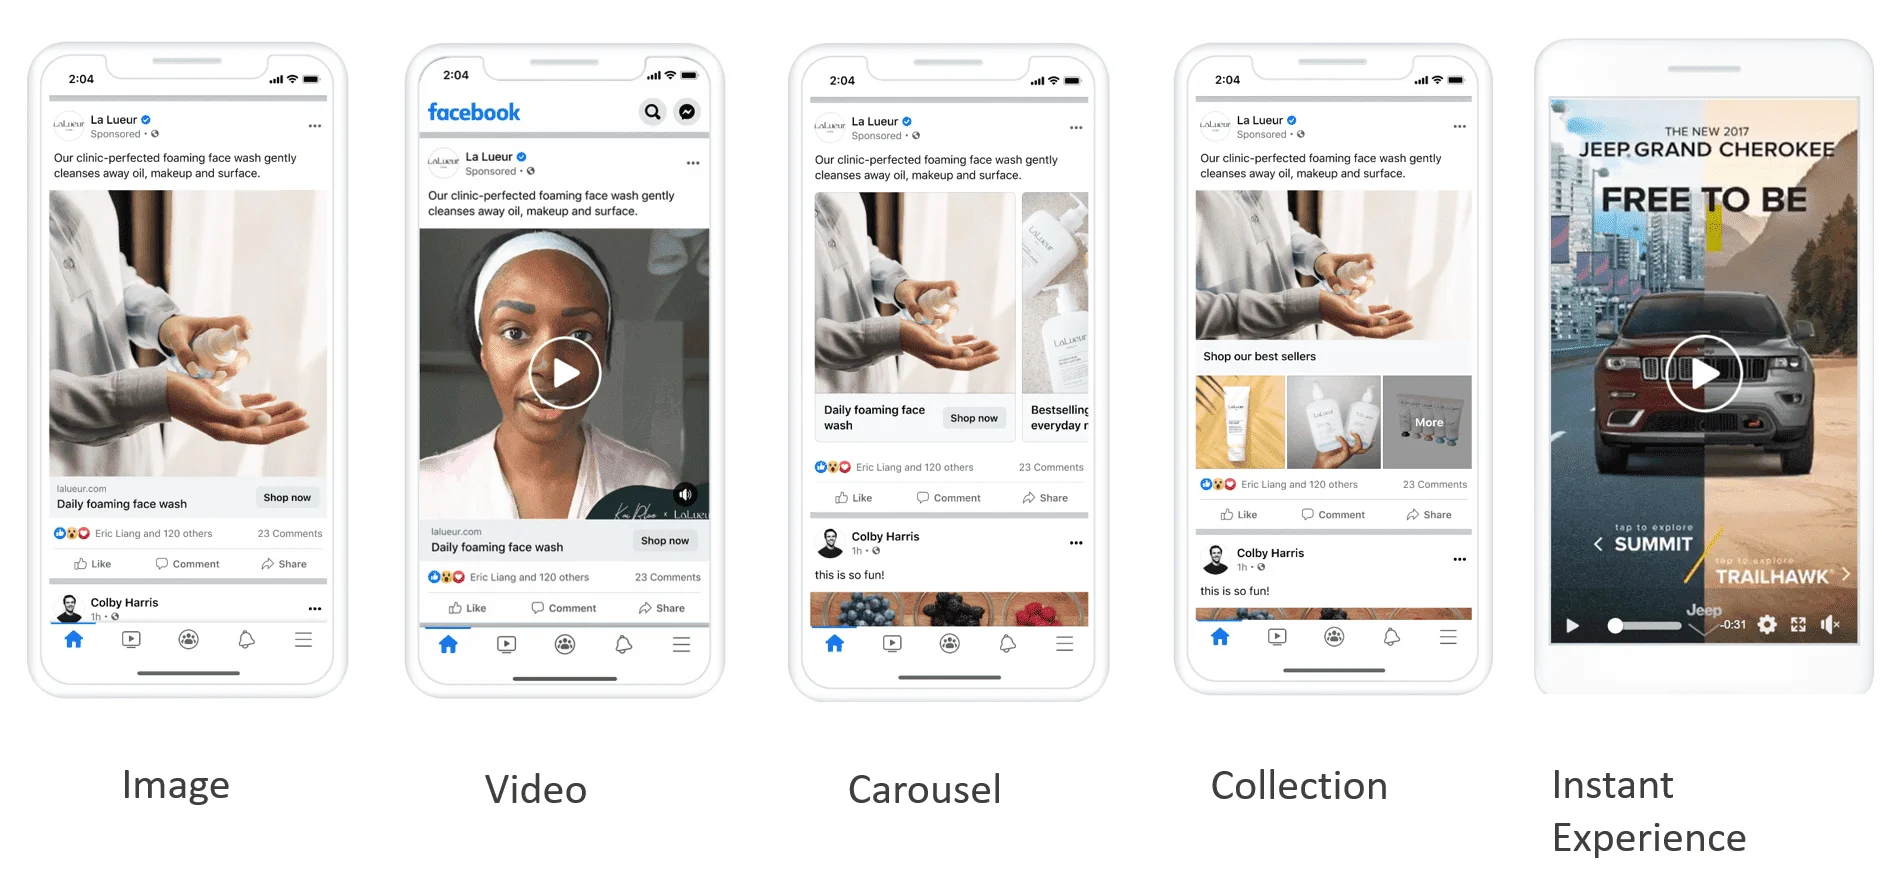
Facebook Ads (Source: Seen)
Facebook leverages analytics to refine news feeds, ads, and campaigns, aligning with user behavior and market trends.
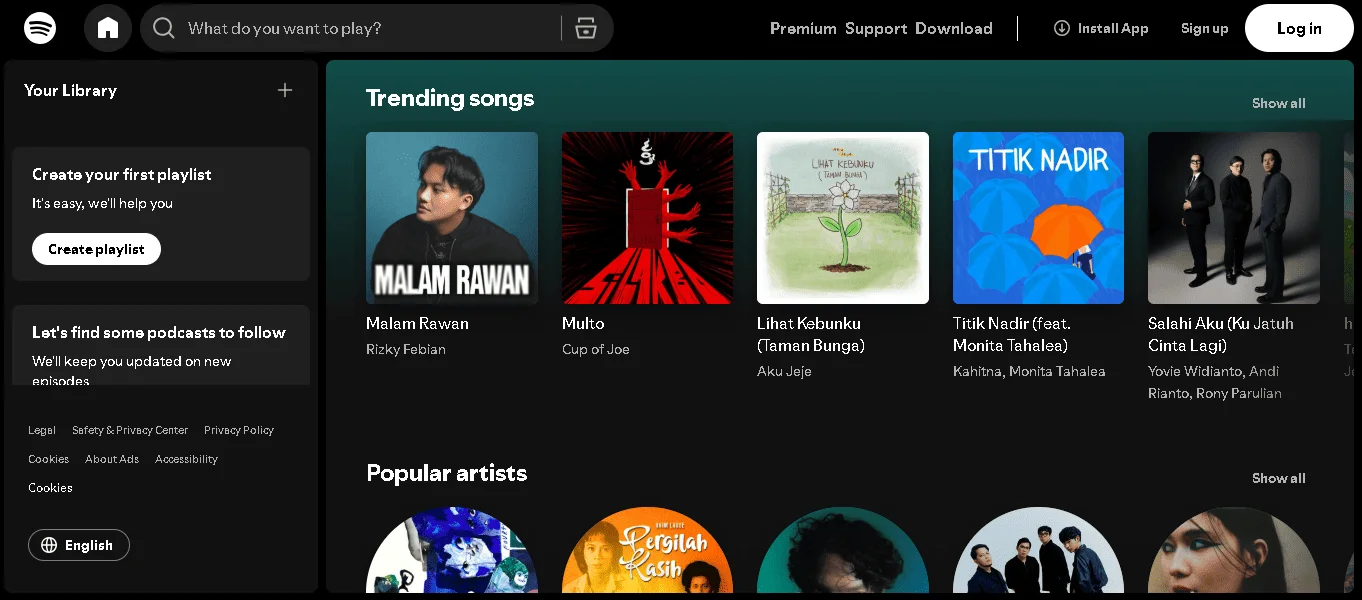
5. Spotify
Spotify Data-Driven Playlist (Source: Spotify)
Spotify builds personalized playlists and data driven graphic design for smooth navigation and retention.
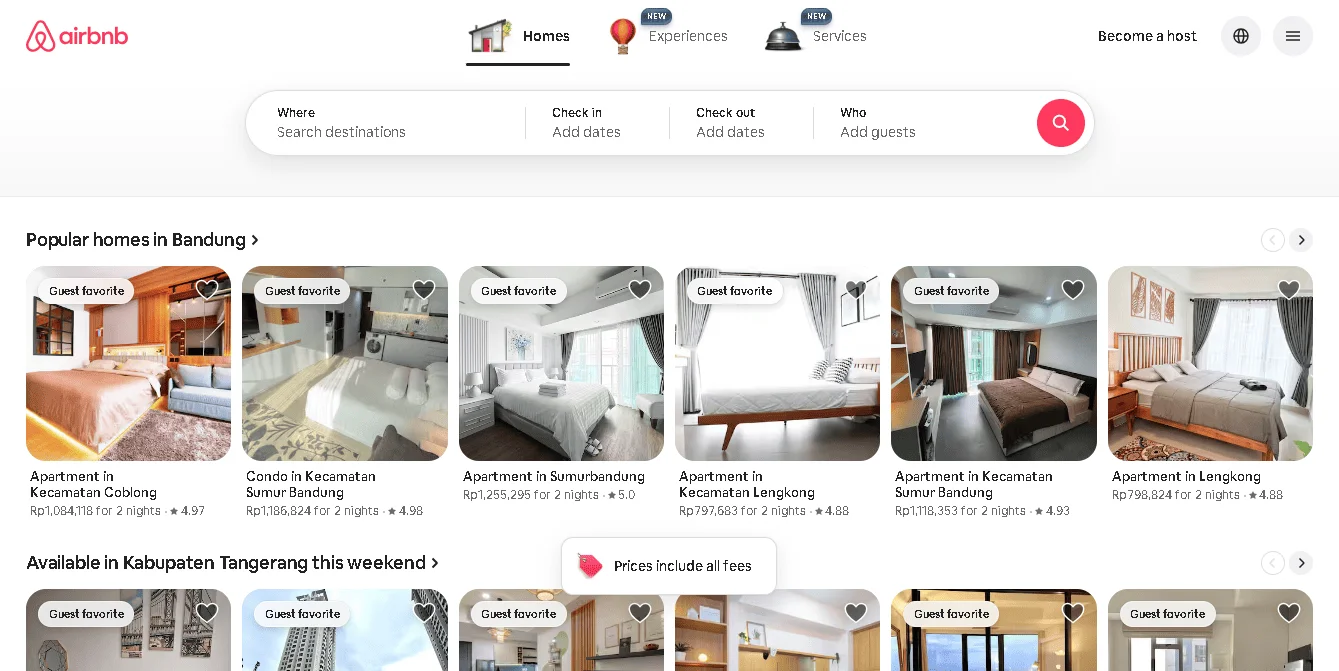
6. Airbnb
Location-Based Data Airbnb (Source: Airbnb)
Airbnb studies booking behavior to design intuitive filters and appealing listings.
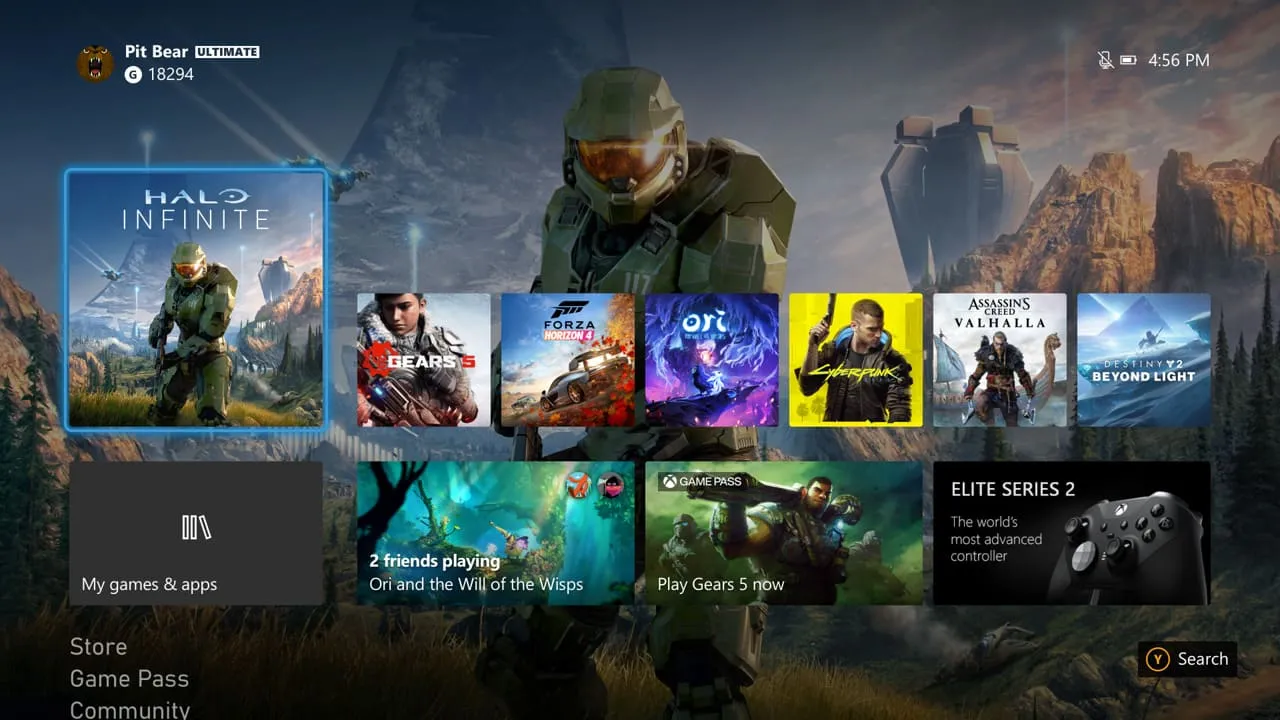
7. Microsoft
User Data for Microsoft Personalization (Source: Xbox Wire)
Microsoft integrates user data into Windows, Office, and Xbox for efficiency and personalization.
Every project benefits from a clearer understanding of its audience. By learning from patterns and feedback, designers can develop solutions that speak directly to user needs. This connection between evidence and creativity builds trust, usability, and long-term impact across different platforms.
While you’re analysing your own data, try visiting Tridimensi, too. Here, you can grab the perfect element for your project. From calming backgrounds to abstract assets, Tridimensi got you covered. With our asset library, you have less to worry about and more time to build your vision.